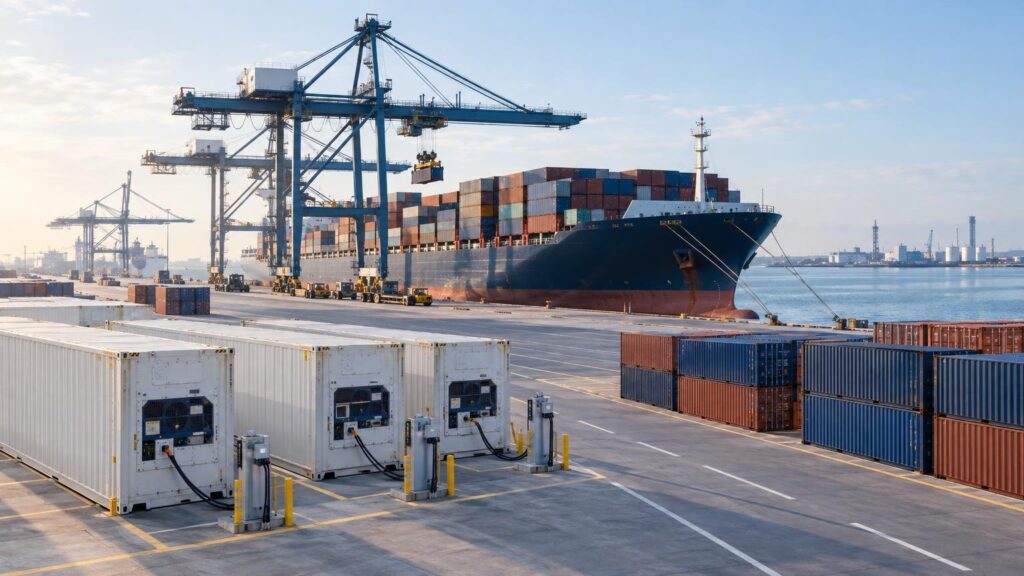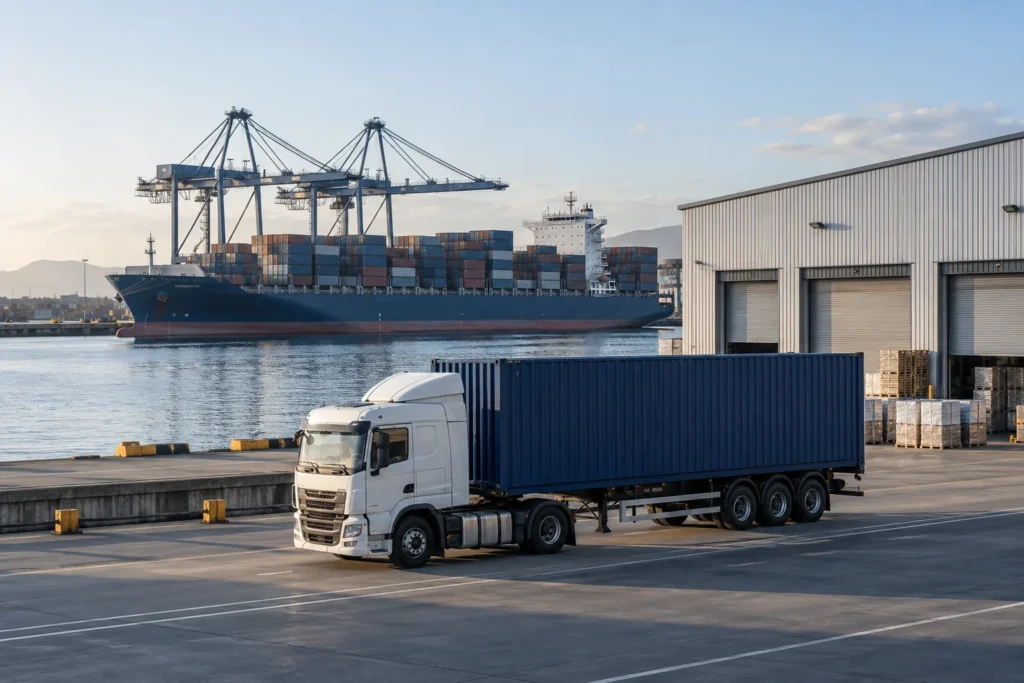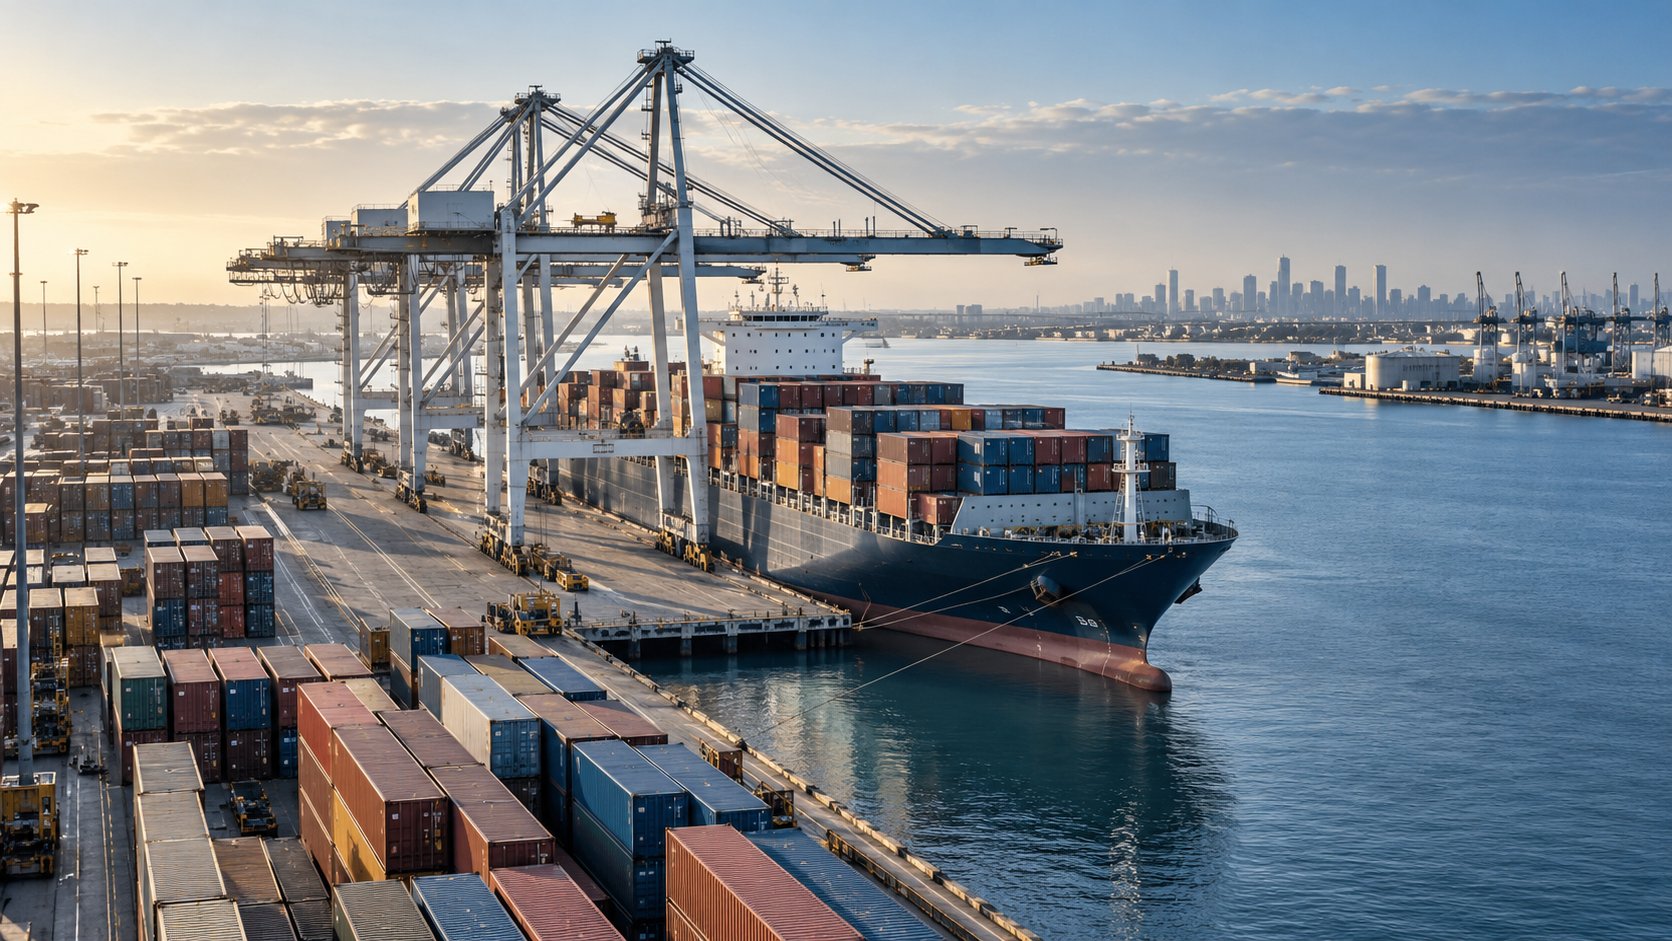
Port of Melbourne handled a record 3.5 million twenty-foot equivalent units (TEU) in calendar 2025, its second consecutive annual high. Its inaugural Trade in Review, launched on 16 June 2026, shows how consumer imports and agricultural exports helped sustain trade through a year of tariff uncertainty.
Behind the total are contrasting commercial exposures. China supplied more than half of full overseas container imports, while overseas exports reached a broader spread of destinations. Southeast Asia was the largest export region, although China remained the biggest individual country market—a distinction that matters when assessing where Australian businesses buy and sell.
Import growth meets concentrated sourcing
Full overseas container imports reached 1.37 million TEU in 2025. China supplied 710,000 TEU, or 52%, well ahead of the United States at 5%. Thailand and Vietnam each accounted for 4%, and Malaysia for 3%. Those smaller origins form part of a more varied sourcing base, though none approached China’s weight in Melbourne’s inbound trade.
Furniture led the reported import commodity categories at 135,000 TEU. Metal manufactures, domestic appliances and non-electrical machinery were also prominent, alongside paperboard products and raw plastics. The mix makes Melbourne a gateway for business inputs and equipment as well as finished household goods.
The port links stronger consumer imports to recovering household demand and suggests Chinese discounting redirected some manufactured goods towards Australia as higher US tariffs weakened demand there. That interpretation points to changes on both sides of the transaction: stronger local purchasing and altered overseas supply. Container volumes alone do not show whether individual importers secured lower prices or better margins.
Agriculture broadens the export map
Full overseas container exports totalled 662,000 TEU. China received 132,000 TEU, or 20%, while Southeast Asia collectively took 27%. New Zealand accounted for 10% and Japan for 7%; Indonesia and the United States each represented 6%. The regional comparison therefore tells a different story from a country-by-country ranking.
Agricultural goods and produce from south-east Australia dominated the export mix. Packaged beef and fresh fruit were the two leading categories shown, followed by hay, chaff and fodder, and wheat. Pulp and waste paper also featured, demonstrating that the outward trade extends beyond food.
The port attributes export resilience to a strong domestic harvest and sustained Asian demand. It also links robust US-bound trade to beef shortages and Australia’s comparatively favourable tariff exposure during 2025. For exporters, the significance is the range of buyers supporting trade, rather than dependence on one destination. That breadth can spread market exposure, but demand for beef, fruit and grain is not interchangeable.
Vehicles and domestic cargo add another dimension
The sourcing shift was particularly visible in automotive trade. Japan remained the largest origin for overseas roll-on, roll-off vehicle imports, with about 106,000 units in 2025. China supplied about 88,000, ahead of Thailand’s 68,000. With overall volumes described as relatively stable at elevated levels, the notable change was the origin mix rather than another surge in vehicle arrivals.
A later FY26 review reported China overtaking Japan as the largest vehicle-import origin for the first time, with a 28% share. That review covers July 2025 to June 2026, giving a newer perspective on the change in suppliers without treating two different reporting periods as a like-for-like growth comparison.
Dry bulk connected a different set of businesses. Imports amounted to 3.5 million revenue tonnes and exports to 2.1 million. Incoming cargo largely comprised construction materials such as cement and gypsum, with most dry bulk imports sourced domestically. Outgoing cargo was dominated by wheat, barley, canola and lentils.
Bass Strait trade also prevents Melbourne’s role from being understood solely through international containers. Cargo arriving from Tasmania included food, agricultural products, forestry outputs and resource commodities. Consumer goods represented 40% of cargo sent to Tasmania in the report’s container-and-wheeled-unit measure, expressed in revenue tonnes. The port serves both production supply chains and household consumption across the strait.
Reading the record without overstating it
The headline container total measures movements, not simply overseas merchandise sales. Empty containers represented 28% of throughput, while full Bass Strait containers accounted for 7%. These flows help explain why the overall record cannot be treated as a direct measure of import or export demand alone.
Reporting periods also matter. The port’s FY25 release pairs about A$154 billion in trade value with 3.39 million TEU for July 2024–June 2025. A subsequent release, published on 17 September 2026, reports 3.52 million TEU for FY26, July 2025–June 2026. These are consecutive financial years; each overlaps part of calendar 2025. Comparing their totals directly with the 3.5 million TEU calendar-year record mixes different reporting windows.
For traders, the useful signal is the structure of the business moving through Melbourne: China-heavy imports, broader agricultural outlets and substantial domestic connections. It is not evidence that a particular shipping lane became faster, cheaper or more congested.